About Audio Analyzer - Time & FFT - Free & No Ads
Manual in PDF format: http://withstrings.com/withstrings_audioanalyzer_manual.pdf 1. Description WithStrings simple Audio Analyzer acquires a signal from the device's microphone and displays its time history and Fourier...
Manual in PDF format:
http://withstrings.com/withstrings_audioanalyzer_manual.pdf
1. Description
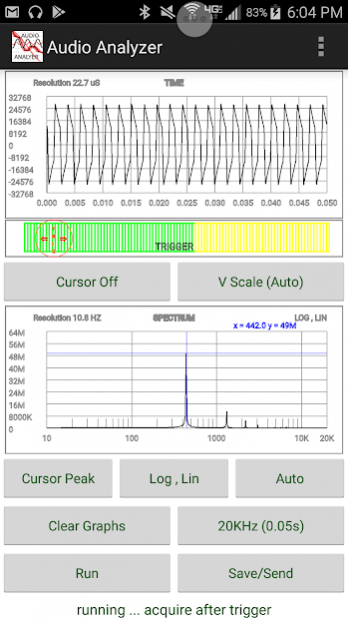
WithStrings simple Audio Analyzer acquires a signal from the device's microphone and displays its time history and Fourier amplitude frequency spectrum (using a FFT algorithm). Sampling of the time history starts when the amplitude of the audio acquired at the microphone is greater than the adjustable trigger level slider. The length of acquisition is adjustable from 0.05 seconds to 1 second. Vertical scales for each of the graphs are independently adjustable or can be set to auto-scale.
2. Operation
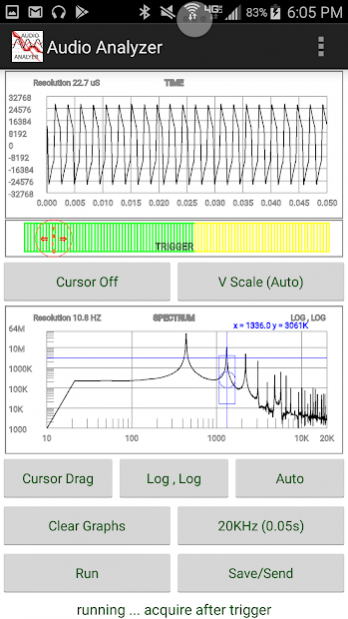
Launch the application. The cursors are initially off, frequency range is set to 20Khz, and vertical scales are set to Auto mode. Pressing the Run button will start acquisition if the input amplitude is greater than the trigger level. Adjust the Trigger level for the desired sensitivity by moving the red circle on the trigger slider. The Freq(Time) button produces inverse results on the time and frequency graph. A wide frequency setting of 20Khz will produce a very small time sampling window of 0.05 seconds. Conversely a 1Khz frequency range will produce a sampling window of 1 second. A Cursor is available for each graph. Pressing the cursor button one time will set it to peak mode. The peak (positive) will be shown on the graph with cross-hairs on the graph; its x,y coordinates are displayed in blue font on the upper right side of the graph. Pressing the cursor button again will allow the cursor cross- hairs to be dragged to any data point on the graph. The x,y coordinates of this point are displayed in blue font on the upper right side of the display.
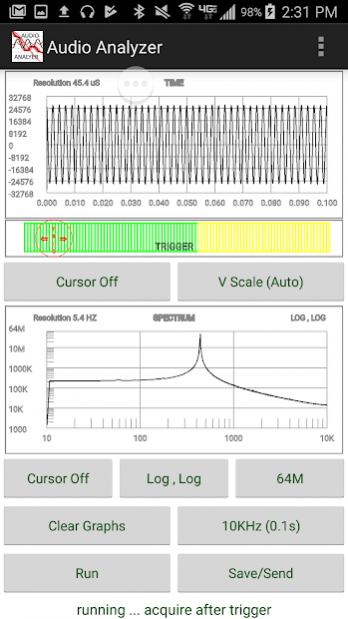
Vertical scales are adjustable for each graph. Auto mode will find the best scale to display all of the datum on the graph. Pressing the scale button will set the vertical scale to one of several predefined scales. Clear will erase data and clear both time and frequency graphs. The Lin , Lin chart type button when set to log mode shows the data equaling the log of the value. The x axis can also be displayed in log mode. These modes are ideal to find small frequency peaks or roll off rates. Note the axis labels are not log values.
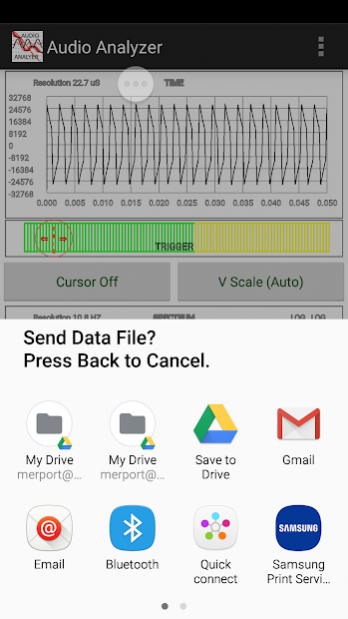
The Save/Send button will capture the time and frequency graph to a comma separated variable file in the following directory: .../Android/data/com.withstrings.audioanalyzer/files. Note all data in this directory will be erased if the app is un-installed. When the save button is pressed a dialog will appear where the file just produced can be sent elsewhere by one of the email apps on the device. There are six columns in the exported chart. The first two are from the time graph showing time and audio amplitude. The next two columns are frequency and amplitude from the Fourier amplitude spectrum. The following are the log of the frequency and amplitude.
3. Characteristics
Operating System: Android: Minimum Version 5.1 (API 22) Lolipop
Permissions: RECORD_AUDIO
Max Acquisition Rate: 44100 samples/s, Number of Samples: 4096 @ 20KHz(0.05s)
Min Acquisition Rate: 2756 samples/s, Number of Samples: 4096 @ 1KHz(1s)
Settings:
Run/Pause
Trigger Slider: 0 to 100% of sampled RMS value.
Time Graph Vertical Scales: 32K, 16K, 8K, 4K, 2K, 1K
Freq Graph Vertical Scales: 64M, 32M, 16M, 8M, 4M, 2M
Freq/Time Scales: 20KHz(0.05s), 10KHz(0.1s), 5KHz(0.2s), 2KHz(0.5s),
1KHz(1s)
Frequency Plots: x axis: linear or log; y axis: linear or log
Cursor: Off, Peak, Slider (Time and Frequency Graphs)
Save/Email: Data writes to the following file in Pause mode:
../Android/data/com.withstrings.audioanalyzer/files. The file can also
be sent via email at the time the Save/Email button is pressed.
Identity: sin(u)sin(v) = 1/2[sin(u-v) + sin(u+v)]
Graphics Design: N. Dynamite
Inspiration: Fr. McKenzie
Crashes: Yes
© 2019 Todd Merport
Previous Versions
Here you can find the changelog of Audio Analyzer - Time & FFT - Free & No Ads since it was posted on our website on 2019-11-06 18:24:28.
The latest version is 1.12 and it was updated on 2024-04-19 22:39:30. See below the changes in each version.
Audio Analyzer - Time & FFT - Free & No Ads version 1.12
Updated At: 2021-07-05
Changes: Minor graphics fixes. Recompiled with Androidx libraries.
Audio Analyzer - Time & FFT - Free & No Ads version 1.11
Updated At: 2019-09-19
Changes: Log plotting on the X axis.
Disclaimer
External Download
We do not host Audio Analyzer - Time & FFT - Free & No Ads on our servers. We did not scan it for viruses, adware, spyware or other type of malware. This app is hosted by Galad and passed their terms and conditions to be listed there. We recommend caution when installing it.
The APK Download link for Audio Analyzer - Time & FFT - Free & No Ads is provided to you by apps112.com without any warranties, representations or guarantees of any kind, so access it at your own risk.
If you have questions regarding this particular app contact the publisher directly. For questions about the functionalities of apps112.com contact us.